view
March 2451
National Assembly Elections in the State of Indrala
The election for the PresidentThe election has been held for the office of President.Results of the First Round | Candidate | Party | Votes | Votes (%) | Endorsements | | Ichiro Yamagon | Liberal Democratic Party of Indrala | 33,102,689 | 35.03% | Indrala First Socialists | | Origen of Alexandria | Christian Universalist Party | 17,652,081 | 18.68% | | | Adrian Stilton | United Justice Party | 15,395,231 | 16.29% | | | Lord Zorgoth | Feudal Socialist Revolutionary Party | 13,062,531 | 13.82% | | | Saori Yoshida | Fabulous Gay Party | 9,260,536 | 9.80% | | | Frank Brimginton | People's Front of Indrala | 5,963,820 | 6.31% | | | Total | | 94,436,888 | 100% | |
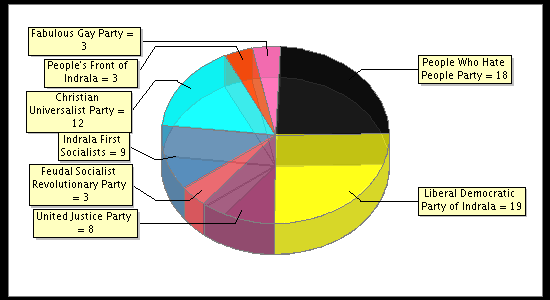
Results of the Second Round The elections were won by Ichiro Yamagon of the Liberal Democratic Party of Indrala. Elections for the National AssemblyLegislative elections have been held for the National Assembly in the State of Indrala. There were 114,752,412 people with suffrage. A total of 95,213,417 votes have been cast, putting turnout at a magnificent 82.97%. There were 75 seats up for grabs.National results: | Party | Votes | Votes (%) | Seats | Seats (%) | Difference | Difference (seat share) | | Liberal Democratic Party of Indrala | 22,779,319 | 23.92% | 19 | 25.33% | +4 | +1.14% | | People Who Hate People Party | 20,563,226 | 21.60% | 18 | 24.00% | +18 | +24.00% | | Christian Universalist Party | 13,561,830 | 14.24% | 12 | 16.00% | -5 | -11.42% | | Indrala First Socialists | 10,893,863 | 11.44% | 9 | 12.00% | -2 | -5.74% | | United Justice Party | 10,917,385 | 11.47% | 8 | 10.67% | -2 | -5.46% | | Fabulous Gay Party | 6,145,784 | 6.45% | 3 | 4.00% | +0 | -0.84% | | People's Front of Indrala | 5,292,978 | 5.56% | 3 | 4.00% | +2 | +2.39% | | Feudal Socialist Revolutionary Party | 5,059,032 | 5.31% | 3 | 4.00% | -2 | -4.06% | | Total | 95,213,417 | 100% | 75 | 100% | |
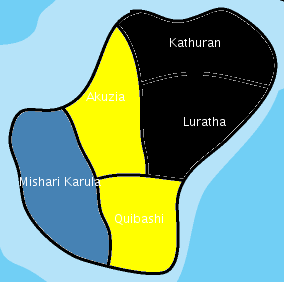
Census: | Region | Population | Population (%) | Seats | Seats (%) | | Quibashi | 35,934,630 | 23.49% | 18 | 24% | | Akuzia | 35,764,559 | 23.38% | 17 | 23% | | Luratha | 28,745,066 | 18.79% | 14 | 19% | | Kathuran | 28,364,495 | 18.54% | 14 | 19% | | Mishari Karula | 24,194,468 | 15.81% | 12 | 16% | | Total | 153,003,218 | 100% | 75 | 100% |
Region Map: 
Seats: 
Quibashi Province: | Party | Votes | Votes (%) | Seats | Seats (%) | | Liberal Democratic Party of Indrala | 8,620,138 | 38.77% | 8 | 44.44% | | Christian Universalist Party | 4,674,790 | 21.03% | 4 | 22.22% | | People Who Hate People Party | 3,332,970 | 14.99% | 3 | 16.67% | | Fabulous Gay Party | 1,910,997 | 8.60% | 1 | 5.56% | | United Justice Party | 1,306,028 | 5.87% | 1 | 5.56% | | Indrala First Socialists | 1,012,902 | 4.56% | 1 | 5.56% | | Feudal Socialist Revolutionary Party | 786,767 | 3.54% | 0 | 0.00% | | People's Front of Indrala | 587,094 | 2.64% | 0 | 0.00% | | Total | 22,231,686 | 100% | 18 | 100% |
Akuzia Province: | Party | Votes | Votes (%) | Seats | Seats (%) | | Liberal Democratic Party of Indrala | 8,265,824 | 35.89% | 7 | 41.18% | | Christian Universalist Party | 4,761,689 | 20.67% | 4 | 23.53% | | Indrala First Socialists | 2,425,199 | 10.53% | 2 | 11.76% | | People Who Hate People Party | 2,152,500 | 9.35% | 1 | 5.88% | | United Justice Party | 1,790,055 | 7.77% | 1 | 5.88% | | People's Front of Indrala | 1,373,509 | 5.96% | 1 | 5.88% | | Feudal Socialist Revolutionary Party | 1,158,300 | 5.03% | 1 | 5.88% | | Fabulous Gay Party | 1,105,444 | 4.80% | 0 | 0.00% | | Total | 23,032,520 | 100% | 17 | 100% |
Luratha Province: | Party | Votes | Votes (%) | Seats | Seats (%) | | People Who Hate People Party | 5,303,563 | 29.48% | 5 | 35.71% | | Liberal Democratic Party of Indrala | 3,550,509 | 19.74% | 3 | 21.43% | | Indrala First Socialists | 2,873,852 | 15.98% | 2 | 14.29% | | United Justice Party | 2,698,300 | 15.00% | 2 | 14.29% | | People's Front of Indrala | 1,429,548 | 7.95% | 1 | 7.14% | | Christian Universalist Party | 1,121,909 | 6.24% | 1 | 7.14% | | Feudal Socialist Revolutionary Party | 824,275 | 4.58% | 0 | 0.00% | | Fabulous Gay Party | 186,219 | 1.04% | 0 | 0.00% | | Total | 17,988,175 | 100% | 14 | 100% |
Kathuran Province: | Party | Votes | Votes (%) | Seats | Seats (%) | | People Who Hate People Party | 8,030,824 | 44.74% | 8 | 57.14% | | United Justice Party | 3,426,782 | 19.09% | 3 | 21.43% | | Indrala First Socialists | 1,819,647 | 10.14% | 1 | 7.14% | | Feudal Socialist Revolutionary Party | 1,322,817 | 7.37% | 1 | 7.14% | | Christian Universalist Party | 1,066,144 | 5.94% | 1 | 7.14% | | People's Front of Indrala | 945,263 | 5.27% | 0 | 0.00% | | Liberal Democratic Party of Indrala | 856,580 | 4.77% | 0 | 0.00% | | Fabulous Gay Party | 480,288 | 2.68% | 0 | 0.00% | | Total | 17,948,345 | 100% | 14 | 100% |
Mishari Karula Province: | Party | Votes | Votes (%) | Seats | Seats (%) | | Indrala First Socialists | 2,762,263 | 19.71% | 3 | 25.00% | | Fabulous Gay Party | 2,462,836 | 17.58% | 2 | 16.67% | | Christian Universalist Party | 1,937,298 | 13.83% | 2 | 16.67% | | People Who Hate People Party | 1,743,369 | 12.44% | 1 | 8.33% | | United Justice Party | 1,696,220 | 12.10% | 1 | 8.33% | | Liberal Democratic Party of Indrala | 1,486,268 | 10.61% | 1 | 8.33% | | Feudal Socialist Revolutionary Party | 966,873 | 6.90% | 1 | 8.33% | | People's Front of Indrala | 957,564 | 6.83% | 1 | 8.33% | | Total | 14,012,691 | 100% | 12 | 100% |
|

