view
March 2533
General Assembly Elections in the Republic of Kirlawa
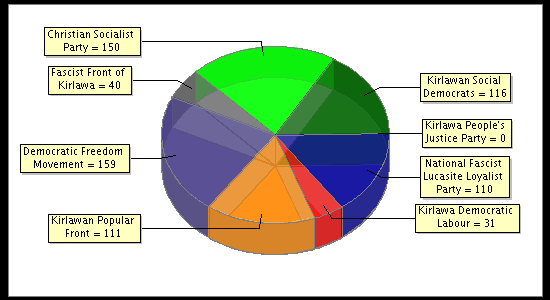
The election for the PresidentThe election has been held for the office of President.Results of the First Round Results of the Second Round The elections were won by Ian Kerslake of the Kirlawan Social Democrats. Elections for the General AssemblyLegislative elections have been held for the General Assembly in the Republic of Kirlawa. There were 155,824,723 people with suffrage. A total of 122,762,610 votes have been cast, putting turnout at a satisfying 78.78%. There were 717 seats up for grabs.National results: | Party | Votes | Votes (%) | Seats | Seats (%) | Difference | Difference (seat share) | | Democratic Freedom Movement | 26,323,791 | 21.44% | 159 | 22.18% | +70 | +9.76% | | Christian Socialist Party | 25,602,940 | 20.86% | 150 | 20.92% | +65 | +9.07% | | Kirlawan Social Democrats | 20,883,524 | 17.01% | 116 | 16.18% | -29 | -4.04% | | Kirlawan Popular Front | 18,396,915 | 14.99% | 111 | 15.48% | +15 | +2.09% | | National Fascist Lucasite Loyalist Party | 19,272,476 | 15.70% | 110 | 15.34% | -48 | -6.69% | | Fascist Front of Kirlawa | 6,777,371 | 5.52% | 40 | 5.58% | -28 | -3.91% | | Kirlawa Democratic Labour | 5,402,347 | 4.40% | 31 | 4.32% | -45 | -6.28% | | Kirlawa People's Justice Party | 103,246 | 0.08% | 0 | 0.00% | +0 | | | Total | 122,762,610 | 100% | 717 | 100% | |
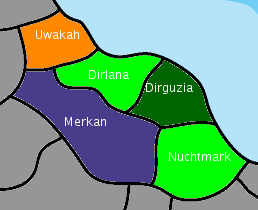
Census: | Region | Population | Population (%) | Seats | Seats (%) | | Uwakah | 47,096,581 | 22.67% | 162 | 23% | | Nuchtmark | 44,775,274 | 21.55% | 154 | 21% | | Dirguzia | 43,329,749 | 20.86% | 150 | 21% | | Dirlana | 39,885,481 | 19.20% | 138 | 19% | | Merkan | 32,679,217 | 15.73% | 113 | 16% | | Total | 207,766,302 | 100% | 717 | 100% |
Region Map: 
Seats: 
Uwakah Province: | Party | Votes | Votes (%) | Seats | Seats (%) | | Kirlawan Popular Front | 7,411,554 | 28.09% | 46 | 28.40% | | Democratic Freedom Movement | 6,400,983 | 24.26% | 40 | 24.69% | | Christian Socialist Party | 4,305,032 | 16.32% | 26 | 16.05% | | National Fascist Lucasite Loyalist Party | 2,831,313 | 10.73% | 17 | 10.49% | | Kirlawan Social Democrats | 2,306,030 | 8.74% | 14 | 8.64% | | Kirlawa Democratic Labour | 1,936,813 | 7.34% | 12 | 7.41% | | Fascist Front of Kirlawa | 1,173,739 | 4.45% | 7 | 4.32% | | Kirlawa People's Justice Party | 20,020 | 0.08% | 0 | 0.00% | | Total | 26,385,484 | 100% | 162 | 100% |
Nuchtmark Province: | Party | Votes | Votes (%) | Seats | Seats (%) | | Christian Socialist Party | 7,337,496 | 27.67% | 43 | 27.92% | | Democratic Freedom Movement | 7,293,955 | 27.51% | 43 | 27.92% | | National Fascist Lucasite Loyalist Party | 4,319,132 | 16.29% | 25 | 16.23% | | Fascist Front of Kirlawa | 2,259,831 | 8.52% | 13 | 8.44% | | Kirlawan Popular Front | 1,851,996 | 6.98% | 11 | 7.14% | | Kirlawan Social Democrats | 1,824,187 | 6.88% | 10 | 6.49% | | Kirlawa Democratic Labour | 1,597,859 | 6.03% | 9 | 5.84% | | Kirlawa People's Justice Party | 31,952 | 0.12% | 0 | 0.00% | | Total | 26,516,408 | 100% | 154 | 100% |
Dirguzia Province: | Party | Votes | Votes (%) | Seats | Seats (%) | | Kirlawan Social Democrats | 12,302,362 | 43.21% | 66 | 44.00% | | National Fascist Lucasite Loyalist Party | 6,187,737 | 21.73% | 33 | 22.00% | | Christian Socialist Party | 4,172,705 | 14.65% | 22 | 14.67% | | Democratic Freedom Movement | 2,360,773 | 8.29% | 12 | 8.00% | | Kirlawan Popular Front | 2,191,094 | 7.70% | 11 | 7.33% | | Kirlawa Democratic Labour | 854,106 | 3.00% | 4 | 2.67% | | Fascist Front of Kirlawa | 386,905 | 1.36% | 2 | 1.33% | | Kirlawa People's Justice Party | 17,878 | 0.06% | 0 | 0.00% | | Total | 28,473,560 | 100% | 150 | 100% |
Dirlana Province: | Party | Votes | Votes (%) | Seats | Seats (%) | | Christian Socialist Party | 8,194,480 | 35.13% | 49 | 35.51% | | Democratic Freedom Movement | 4,803,847 | 20.60% | 29 | 21.01% | | National Fascist Lucasite Loyalist Party | 3,790,162 | 16.25% | 22 | 15.94% | | Kirlawan Social Democrats | 2,582,607 | 11.07% | 15 | 10.87% | | Kirlawan Popular Front | 2,242,342 | 9.61% | 13 | 9.42% | | Fascist Front of Kirlawa | 1,347,567 | 5.78% | 8 | 5.80% | | Kirlawa Democratic Labour | 339,942 | 1.46% | 2 | 1.45% | | Kirlawa People's Justice Party | 23,865 | 0.10% | 0 | 0.00% | | Total | 23,324,812 | 100% | 138 | 100% |
Merkan Province: | Party | Votes | Votes (%) | Seats | Seats (%) | | Democratic Freedom Movement | 5,464,233 | 30.25% | 35 | 30.97% | | Kirlawan Popular Front | 4,699,929 | 26.02% | 30 | 26.55% | | National Fascist Lucasite Loyalist Party | 2,144,132 | 11.87% | 13 | 11.50% | | Kirlawan Social Democrats | 1,868,338 | 10.34% | 11 | 9.73% | | Fascist Front of Kirlawa | 1,609,329 | 8.91% | 10 | 8.85% | | Christian Socialist Party | 1,593,227 | 8.82% | 10 | 8.85% | | Kirlawa Democratic Labour | 673,627 | 3.73% | 4 | 3.54% | | Kirlawa People's Justice Party | 9,531 | 0.05% | 0 | 0.00% | | Total | 18,062,346 | 100% | 113 | 100% |
|


