view
January 4067
Democratic Republic of Solentia Senate Elections in the Democratic Republic of Solentia
The election for the PresidentThe election has been held for the office of President.Results of the First Round | Candidate | Party | Votes | Votes (%) | Endorsements | | Ali ibn Ahmad | Conservative Socialist Party | 20,516,760 | 32.57% | | | Maritza Ramos | The Progressive Democrats | 16,861,075 | 26.77% | | | Hermione Edwards | Country Party of Solentia | 10,542,671 | 16.74% | | | Alex Brown | New Socialists Party | 5,926,984 | 9.41% | | | Geralt Greenberg | Libertarian Socialist Resistance (LSR) | 4,663,394 | 7.40% | Libertarian Socialist Confederation | | Hillary Fitzpatrick | Republican Democrats | 4,439,968 | 7.05% | | | Total | | 62,950,852 | 100% | |
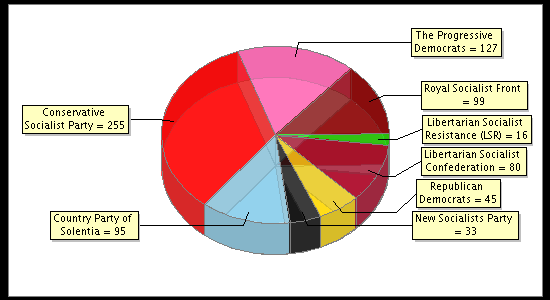
Results of the Second Round The elections were won by Maritza Ramos of the The Progressive Democrats. Elections for the Democratic Republic of Solentia SenateLegislative elections have been held for the Democratic Republic of Solentia Senate in the Democratic Republic of Solentia. There were 74,729,655 people with suffrage. A total of 63,321,234 votes have been cast, putting turnout at a magnificent 84.73%. There were 750 seats up for grabs.National results: | Party | Votes | Votes (%) | Seats | Seats (%) | Difference | Difference (seat share) | | Conservative Socialist Party | 21,112,565 | 33.34% | 255 | 34.00% | +51 | +6.80% | | The Progressive Democrats | 10,676,935 | 16.86% | 127 | 16.93% | +127 | +16.93% | | Royal Socialist Front | 8,304,319 | 13.11% | 99 | 13.20% | +99 | +13.20% | | Country Party of Solentia | 8,043,157 | 12.70% | 95 | 12.67% | -30 | -4.00% | | Libertarian Socialist Confederation | 6,849,221 | 10.82% | 80 | 10.67% | -36 | -4.80% | | Republican Democrats | 3,926,668 | 6.20% | 45 | 6.00% | -87 | -11.60% | | New Socialists Party | 2,902,196 | 4.58% | 33 | 4.40% | -29 | -3.87% | | Libertarian Socialist Resistance (LSR) | 1,506,173 | 2.38% | 16 | 2.13% | -95 | -12.67% | | Total | 63,321,234 | 100% | 750 | 100% | |
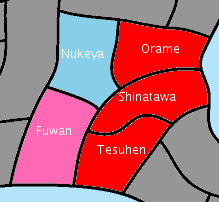
Census: | Region | Population | Population (%) | Seats | Seats (%) | | Fuwan | 20,018,824 | 20.09% | 150 | 20% | | Orame | 19,960,455 | 20.03% | 150 | 20% | | Shinatawa | 19,899,044 | 19.97% | 150 | 20% | | Nukeya | 19,885,385 | 19.96% | 150 | 20% | | Tesuhen | 19,875,834 | 19.95% | 150 | 20% | | Total | 99,639,542 | 100% | 750 | 100% |
Region Map: 
Seats: 
Fuwan State: | Party | Votes | Votes (%) | Seats | Seats (%) | | The Progressive Democrats | 3,676,718 | 28.98% | 44 | 29.33% | | Conservative Socialist Party | 3,399,038 | 26.79% | 41 | 27.33% | | Libertarian Socialist Confederation | 1,974,211 | 15.56% | 23 | 15.33% | | Royal Socialist Front | 1,913,808 | 15.09% | 23 | 15.33% | | Libertarian Socialist Resistance (LSR) | 585,371 | 4.61% | 7 | 4.67% | | Republican Democrats | 495,234 | 3.90% | 6 | 4.00% | | New Socialists Party | 485,998 | 3.83% | 5 | 3.33% | | Country Party of Solentia | 154,994 | 1.22% | 1 | 0.67% | | Total | 12,685,372 | 100% | 150 | 100% |
Orame State: | Party | Votes | Votes (%) | Seats | Seats (%) | | Conservative Socialist Party | 6,376,790 | 50.38% | 77 | 51.33% | | The Progressive Democrats | 2,304,043 | 18.20% | 28 | 18.67% | | Libertarian Socialist Confederation | 1,433,074 | 11.32% | 17 | 11.33% | | Royal Socialist Front | 1,293,766 | 10.22% | 15 | 10.00% | | Libertarian Socialist Resistance (LSR) | 404,385 | 3.19% | 4 | 2.67% | | New Socialists Party | 374,054 | 2.95% | 4 | 2.67% | | Republican Democrats | 373,550 | 2.95% | 4 | 2.67% | | Country Party of Solentia | 98,913 | 0.78% | 1 | 0.67% | | Total | 12,658,575 | 100% | 150 | 100% |
Shinatawa State: | Party | Votes | Votes (%) | Seats | Seats (%) | | Conservative Socialist Party | 3,997,362 | 31.95% | 49 | 32.67% | | The Progressive Democrats | 2,167,844 | 17.33% | 26 | 17.33% | | Republican Democrats | 1,871,294 | 14.96% | 22 | 14.67% | | Libertarian Socialist Confederation | 1,813,909 | 14.50% | 22 | 14.67% | | Royal Socialist Front | 1,153,379 | 9.22% | 14 | 9.33% | | Country Party of Solentia | 798,511 | 6.38% | 9 | 6.00% | | New Socialists Party | 676,051 | 5.40% | 8 | 5.33% | | Libertarian Socialist Resistance (LSR) | 32,835 | 0.26% | 0 | 0.00% | | Total | 12,511,185 | 100% | 150 | 100% |
Nukeya State: | Party | Votes | Votes (%) | Seats | Seats (%) | | Country Party of Solentia | 6,793,259 | 53.42% | 82 | 54.67% | | Royal Socialist Front | 2,703,264 | 21.26% | 32 | 21.33% | | New Socialists Party | 925,933 | 7.28% | 11 | 7.33% | | Conservative Socialist Party | 840,572 | 6.61% | 10 | 6.67% | | Republican Democrats | 655,706 | 5.16% | 7 | 4.67% | | Libertarian Socialist Confederation | 489,297 | 3.85% | 5 | 3.33% | | The Progressive Democrats | 219,967 | 1.73% | 2 | 1.33% | | Libertarian Socialist Resistance (LSR) | 89,606 | 0.70% | 1 | 0.67% | | Total | 12,717,604 | 100% | 150 | 100% |
Tesuhen State: | Party | Votes | Votes (%) | Seats | Seats (%) | | Conservative Socialist Party | 6,498,803 | 50.98% | 78 | 52.00% | | The Progressive Democrats | 2,308,363 | 18.11% | 27 | 18.00% | | Royal Socialist Front | 1,240,102 | 9.73% | 15 | 10.00% | | Libertarian Socialist Confederation | 1,138,730 | 8.93% | 13 | 8.67% | | Republican Democrats | 530,884 | 4.16% | 6 | 4.00% | | New Socialists Party | 440,160 | 3.45% | 5 | 3.33% | | Libertarian Socialist Resistance (LSR) | 393,976 | 3.09% | 4 | 2.67% | | Country Party of Solentia | 197,480 | 1.55% | 2 | 1.33% | | Total | 12,748,498 | 100% | 150 | 100% |
|


