view
October 2200
Parliament Elections in the Republic of Trigunia
The election for the PresidentThe election has been held for the office of President.Results of the First Round | Candidate | Party | Votes | Votes (%) | Endorsements | | Jennifer Menk | Trigunia Capitalist Party | 6,921,432 | 14.86% | | | George W. Beige | Fasces Kromina Conservatives | 6,711,609 | 14.41% | | | Stephen Windsor | Neo-Liberal Party of Trigunia | 6,449,457 | 13.85% | | | Vladimir Illich Lenin | Trigunian Social-Democratic Workers | 5,985,928 | 12.85% | | | Julia Klein | Liberty Party | 5,925,163 | 12.72% | | | J.T. Scott | Radical Conservative Party | 5,614,167 | 12.05% | | | Wolfgang Mandolix | Fascist Party | 5,418,863 | 11.63% | | | Steven "Scooter" Wilson | Orange Party | 3,554,656 | 7.63% | | | Total | | 46,581,275 | 100% | |
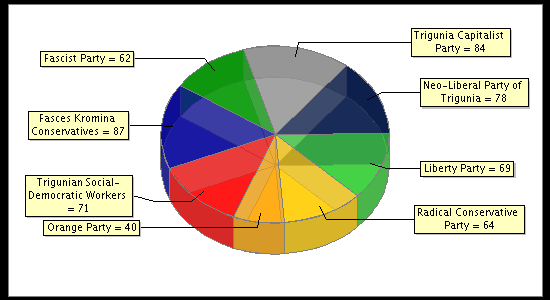
Results of the Second Round The elections were won by Jennifer Menk of the Trigunia Capitalist Party. Elections for the ParliamentLegislative elections have been held for the Parliament in the Republic of Trigunia. There were 55,149,888 people with suffrage. A total of 46,395,604 votes have been cast, putting turnout at a magnificent 84.13%. There were 555 seats up for grabs.National results: | Party | Votes | Votes (%) | Seats | Seats (%) | Difference | Difference (seat share) | | Fasces Kromina Conservatives | 7,234,894 | 15.59% | 87 | 15.68% | +21 | +3.78% | | Trigunia Capitalist Party | 6,969,722 | 15.02% | 84 | 15.14% | +11 | +1.98% | | Neo-Liberal Party of Trigunia | 6,465,737 | 13.94% | 78 | 14.05% | -5 | -0.90% | | Trigunian Social-Democratic Workers | 5,842,115 | 12.59% | 71 | 12.79% | +4 | +0.72% | | Liberty Party | 5,737,742 | 12.37% | 69 | 12.43% | -5 | -0.90% | | Radical Conservative Party | 5,471,275 | 11.79% | 64 | 11.53% | -26 | -4.68% | | Fascist Party | 5,215,030 | 11.24% | 62 | 11.17% | +5 | +0.90% | | Orange Party | 3,459,089 | 7.46% | 40 | 7.21% | -5 | -0.90% | | Total | 46,395,604 | 100% | 555 | 100% | |
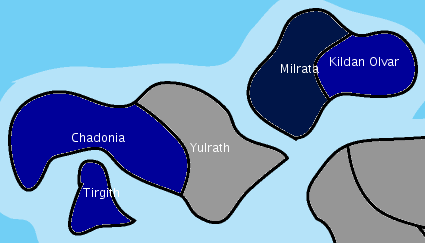
Census: | Region | Population | Population (%) | Seats | Seats (%) | | Yulrath | 16,418,638 | 22.33% | 124 | 22% | | Kildan Olvar | 16,355,565 | 22.24% | 124 | 22% | | Tirgith | 15,157,770 | 20.61% | 114 | 21% | | Chadonia | 14,307,754 | 19.46% | 108 | 19% | | Milrata | 11,293,461 | 15.36% | 85 | 15% | | Total | 73,533,188 | 100% | 555 | 100% |
Region Map: 
Seats: 
Yulrath State: | Party | Votes | Votes (%) | Seats | Seats (%) | | Trigunia Capitalist Party | 2,418,448 | 24.55% | 31 | 25.00% | | Neo-Liberal Party of Trigunia | 2,053,067 | 20.84% | 26 | 20.97% | | Liberty Party | 1,322,387 | 13.42% | 17 | 13.71% | | Fasces Kromina Conservatives | 1,265,987 | 12.85% | 16 | 12.90% | | Radical Conservative Party | 1,075,523 | 10.92% | 13 | 10.48% | | Trigunian Social-Democratic Workers | 651,945 | 6.62% | 8 | 6.45% | | Fascist Party | 543,253 | 5.51% | 7 | 5.65% | | Orange Party | 520,098 | 5.28% | 6 | 4.84% | | Total | 9,850,708 | 100% | 124 | 100% |
Kildan Olvar State: | Party | Votes | Votes (%) | Seats | Seats (%) | | Fasces Kromina Conservatives | 2,185,037 | 21.30% | 27 | 21.77% | | Neo-Liberal Party of Trigunia | 1,999,083 | 19.48% | 24 | 19.35% | | Fascist Party | 1,381,669 | 13.47% | 17 | 13.71% | | Trigunia Capitalist Party | 1,342,182 | 13.08% | 16 | 12.90% | | Trigunian Social-Democratic Workers | 1,047,600 | 10.21% | 13 | 10.48% | | Radical Conservative Party | 956,150 | 9.32% | 11 | 8.87% | | Liberty Party | 858,630 | 8.37% | 10 | 8.06% | | Orange Party | 490,336 | 4.78% | 6 | 4.84% | | Total | 10,260,687 | 100% | 124 | 100% |
Tirgith State: | Party | Votes | Votes (%) | Seats | Seats (%) | | Fasces Kromina Conservatives | 1,837,387 | 18.25% | 21 | 18.42% | | Trigunian Social-Democratic Workers | 1,704,912 | 16.93% | 20 | 17.54% | | Radical Conservative Party | 1,474,280 | 14.64% | 17 | 14.91% | | Liberty Party | 1,306,571 | 12.98% | 15 | 13.16% | | Fascist Party | 1,261,770 | 12.53% | 14 | 12.28% | | Trigunia Capitalist Party | 1,014,253 | 10.07% | 11 | 9.65% | | Neo-Liberal Party of Trigunia | 817,809 | 8.12% | 9 | 7.89% | | Orange Party | 650,655 | 6.46% | 7 | 6.14% | | Total | 10,067,637 | 100% | 114 | 100% |
Chadonia State: | Party | Votes | Votes (%) | Seats | Seats (%) | | Fasces Kromina Conservatives | 1,508,146 | 16.28% | 18 | 16.67% | | Radical Conservative Party | 1,494,010 | 16.13% | 17 | 15.74% | | Trigunia Capitalist Party | 1,385,291 | 14.95% | 16 | 14.81% | | Liberty Party | 1,375,620 | 14.85% | 16 | 14.81% | | Fascist Party | 1,260,411 | 13.61% | 15 | 13.89% | | Trigunian Social-Democratic Workers | 1,245,726 | 13.45% | 15 | 13.89% | | Orange Party | 799,699 | 8.63% | 9 | 8.33% | | Neo-Liberal Party of Trigunia | 195,068 | 2.11% | 2 | 1.85% | | Total | 9,263,971 | 100% | 108 | 100% |
Milrata State: | Party | Votes | Votes (%) | Seats | Seats (%) | | Neo-Liberal Party of Trigunia | 1,400,710 | 20.15% | 17 | 20.00% | | Trigunian Social-Democratic Workers | 1,191,932 | 17.14% | 15 | 17.65% | | Orange Party | 998,301 | 14.36% | 12 | 14.12% | | Liberty Party | 874,534 | 12.58% | 11 | 12.94% | | Trigunia Capitalist Party | 809,548 | 11.64% | 10 | 11.76% | | Fascist Party | 767,927 | 11.05% | 9 | 10.59% | | Radical Conservative Party | 471,312 | 6.78% | 6 | 7.06% | | Fasces Kromina Conservatives | 438,337 | 6.30% | 5 | 5.88% | | Total | 6,952,601 | 100% | 85 | 100% |
|


